I’ve been working on practicing my Python skills by working on getting various temperature statistics from my home server room into Influxdb, Then charting them with Grafana. It’s pretty amazing what you can do with a minimal investment of parts, and a little time. It’s also a chance to get down and dirty on some basic hardware circuit design. Here’s a little overview of a simple project I did to create a very cheap Server Room Temperature Monitor.
Raspberry Pi Based Server Room Monitor –
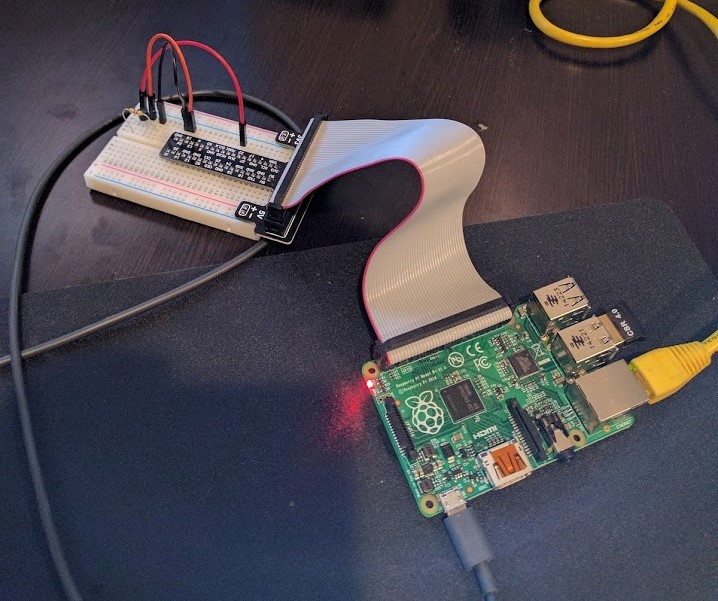
This project was pretty straight forward. Using a spare Raspberry Pi 2 unit I simply followed this guide and built a simple circuit based around the DS18B20+ Temperature Sensor. Then, we can use this basic python library to manipulate data coming from the sensor, and spit that into our database of choice. Putting data into InfluxDB is simple, as it accepts JSON objects with a very simple structure.
from w1thermsensor import W1ThermSensor
from influxdb import InfluxDBClient


#Define Sensor
sensor = W1ThermSensor()
#Grag Current Temp in F
temp = sensor.get_temperature(W1ThermSensor.DEGREES_F)

#Define influxdb stuff
host='192.168.99.118'
port='8086'
dbname = 'cacti2'
query = 'select value from cpu_load_short;'

client = InfluxDBClient(host=host, port=port, database=dbname)

json_body = [
        {
            "tags": {
                "host": "pi_probe",
            },
            "measurement": "server_room_temp",
            "fields": {
                "Float_value": temp,
            }
        }
    ]


print("Write points: {0}".format(json_body))
client.write_points(json_body)

print("Queying data: " + query)
result = client.query(query)
This creates data that looks like this in your influxdb measurement –
> select * from server_room_temp where time > now() - 1h
name: server_room_temp
----------------------
time                    Float_value             host
1499743723895380993     93.76159999999999       pi_probe
1499743784084202923     93.65                   pi_probe
1499743844366329248     93.42500000000001       pi_probe
1499743905641947286     93.3116                 pi_probe
1499743964702802151     93.2                    pi_probe
1499744023872379614     93.0866                 pi_probe
1499744084431816560     93.0866                 pi_probe
1499744144600872653     93.0866                 pi_probe
1499744204821777122     93.0866                 pi_probe
1499744264000549604     92.975                  pi_probe
Finally, Using that data we can generate a pretty graph with Grafana-
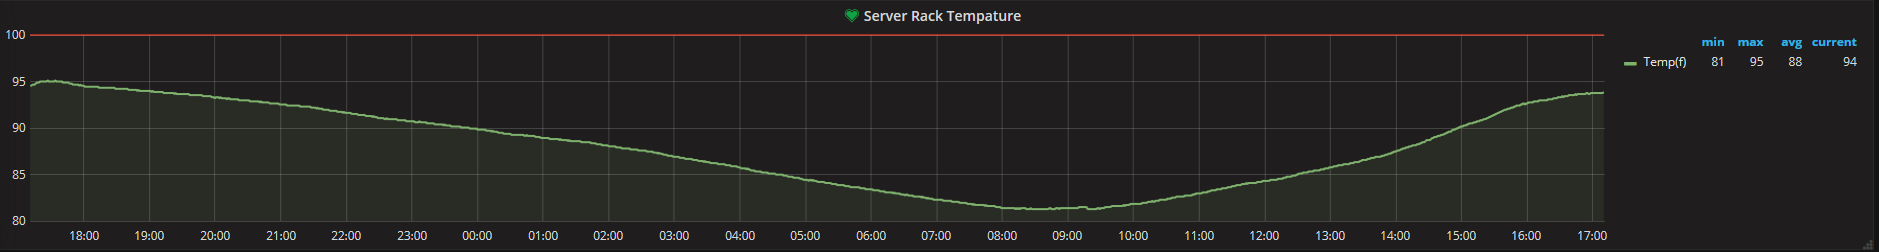
Grafana Alerting also allows us to easily create rules to generate alerts based on conditions within this graph. This means you can monitor your server room temperatures, and get a notification in your slack channel when it reaches a certain level. In my next few posts I’ll show how I further extend this functionality with more data points, and some integration into an HVAC system.