Recently I acquired a second hand APC Smart-UPS 3000. With the cheap addition of a network module SNMP V2/V3 support is easily added to this unit.
The next step is setting up monitoring. To do this I’m going to use parts of the TICK stack, primarily Telegraf (for polling and data collection) and Influxdb (for backend database) – Here’s a short introduction on those modules. Continue reading to see the tasks required to set this up.
https://www.influxdata.com/blog/introduction-to-influxdatas-influxdb-and-tick-stack/
Overview of the setup required for Telegraf SNMP V2 polling and Grafana graphing of an APC UPS
These install instructions assume you are going to be using a newer version of Ubuntu, or another Debian based Linux distribution. I’m also making the assumption you already have InfluxDB installed and configured.
Install the Telegraf agent
sudo apt-get install telegraf
Install NET-SNMP and some basic SNMP MIB’s.
sudo apt-get install snmp-mibs-downloader
sudo download-mibs
Modify your SNMP.conf to import MIB’s we will be downloading
sudo bash -c 'echo "mibs +ALL" > /etc/snmp/snmp.conf'
Download the PowerNet MIB Files from APC
Place the downloaded files in your home folder under “.snmp”. The directory structure should look like this –
.snmp
└── mibs
└── powernet426.mib
By default NET-SNMP will look in several locations for MIB files, including the folder shown above.
At this point, you should be able to run “snmpwalk” and attempt to grab some data from the device. snmpwalk is like nmap, but for scanning SNMP. It should looks like this –
slim@grafana:/etc/snmp$ snmpwalk -v 2c -c public 192.168.99.138 PowerNet-MIB::upsAdvBatteryRunTimeRemaining.0

PowerNet-MIB::upsAdvBatteryRunTimeRemaining.0 = Timeticks: (114000) 0:19:00.00
The result above shows us the Battery Run time remaining in ticks. If you encounter any kind of error, check to make sure all the above packages are installed, and you have everything in the right directories. If you got a result, great, Let’s move on!
Configure the Telegraf conf file for grabbing data from our APC unit with SNMP.
The Telegraf agent requires a conf file with the input information for your device to be queried. By default, it includes telegraf.conf. You can add to this, but I recommend creating a new conf file, 1 per device or group of devices. First, let’s modify the default telegraf.conf file to change some needed variables. This includes
- Default collection interval – Set to 30 seconds
- Influx DB Host
- Influx DB UserName/Password
- InfluxDB Database
You can grab the below example telegraf.conf from my GitHub – and place it in /etc/telegraf/ or run the following script below in a terminal
wget https://raw.githubusercontent.com/nshores/apc-ups-grafana/master/telegraf.conf
sudo mv /etc/telegraf/telegraf.conf telegraf_bak.conf
sudo mv telegraf.conf /etc/telegraf/telegraf.conf
Define a Telegraf conf file for your APC UPS
We are also going need to define a conf file for monitoring our APC ups. This is done by creating a conf file with various inputs in it. You can use the example on my github, and just modify the following to match your setup
 [[inputs.snmp]]
   agents = [ "192.168.99.138" ]
   ## Timeout for each SNMP query.
   timeout = "30s"
   ## Number of retries to attempt within timeout.
   retries = 3
   ## SNMP version, values can be 1, 2, or 3
   version = 2
#  hostname ovveride
   name_override = "ups"
#   ## SNMP community string.
   community = "public"
Place this file in /etc/telegraf/telegraf.d. The final structure looks like this
.
├── telegraf.conf
└── telegraf.d
    └── ups.conf
To confirm everything is working, we can run
telegraf --config /etc/telegraf/telegraf.d/ups.conf --test
This will give us output of the data that it’s collected, and what will be pushed to InfluxDB in the “UPS” measurement. If you don’t have this output, go back and make sure you aren’t missing any steps.
lim@grafana:/etc/snmp$ telegraf --config /etc/telegraf/telegraf.d/ups.conf --test
> ups,agent_host=192.168.99.138,host=grafana,hostname=SLIMUPS model="Smart-UPS 3000 RM",name="UPS_IDEN",upsAdvBatteryReplaceIndicator=1i,upsAdvBatteryRunTimeRemaining=114000i,upsBasicBatteryTimeOnBattery=0i,upsBasicOutputStatus=2i,upsHighPrecBatteryCapacity=100,upsHighPrecBatteryTemperature=32.8,upsHighPrecInputLineVoltage=122.4,upsHighPrecOutputCurrent=4.2,upsHighPrecOutputLoad=19.5,upsHighPrecOutputVoltage=123.1,uptime=8137640i 1540425160000000000
Confirm it’s working and graph your data!
Once you have Telegraf setup, pulling SNMP from your APC UPS and outputting to InfluxDB you can import a great template in your local Grafana to graph this data. The template looks like this
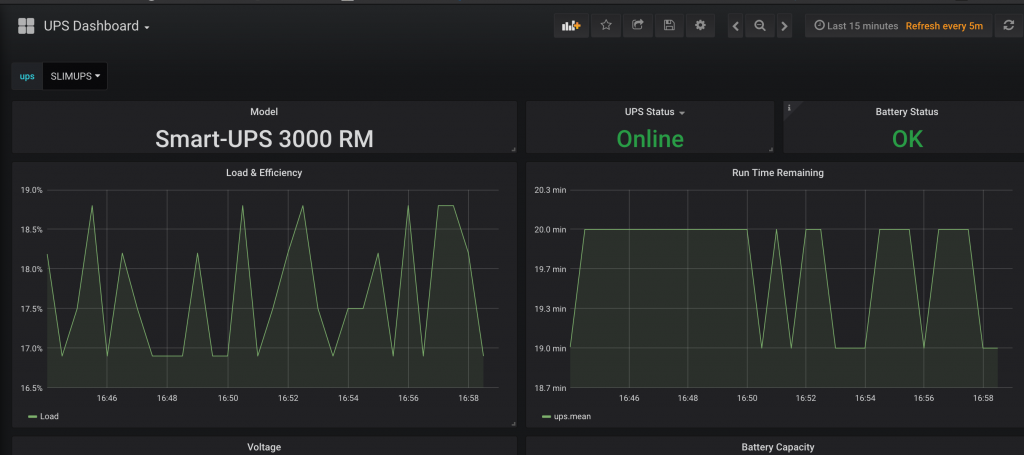
You can view a live demo of the template here.
Reference and source for the telegraph.conf input layout —
Hi,
really thanks for your code and dashboard – I use it too for my 2 UPS & I can confirm it works great. I have some other smaller APC too and was thinking to maybe get this also running on the same dashboard via a USB connected Raspberry pi. Already tested around and there is a tool called “apcupsd” what output the values – so need only a connection to snmp.